Simulation results of the virtual patients database
In this chapter we introduce the online visualization tool, which allows the user to study the simulation results obtained with the Ocular Mathematical Virtual Simulator.
1. The online visualization tool
The online visualization tool is available at the following link eye2brain.feelpp.org/.
Two applications are available: OMVS View and OMVS Compare.
1.1. OMVS View
The first application illustrates the simulation results of the various virtual patients in the database.
The user can select the virtual patient via the dropdown menu. Therefore the different assessments of the selected patient are listed with date, input and a note. This information are followed by all the simulation results in ascending order by level and date.
-
For level0 results, we propose the time evolution of the blood flow within the CRA (central retinal artery) and CRV (central retinal vein) and the time evolution of the average blood pressure and flow within the lamina cribrosa.
-
For level1 results, we replace the punctual time evolution of the hemodynamics of the lamina cribrosa with the three-dimensional spatial distribution of the blood pressure and perfusion velocity within the lamina cribrosa. Some screenshots at different time instants are provided to the user employing the Paraview(www.paraview.org/) interface.
-
Finally, level2 results add to the above description the ensight of the three-dimensional spatial distribution of the displacement within the main tissues of the eye: lamina cribrosa, retina, choroid, sclera and cornea. ( TO COMPLETE: it depends on what it will be available )
| For a more detailed discussion of the features of the three levels see the models and applications section. |
1.2. OMVS Compare
The second application is the OMVS Compare app and it allows to compare two different assessments that can be of two different patients or the same patients at two different moments.
The user has to select the two patient (even the same) and then two bullet point lists will appear with all the possible assessments available for the chosen patients. After the selection of the two assessment that the user would like to compare, this application will automatically provide the comparison of the results that are available for both assessments. This fact means that if the user has selected two assessments that have been obtained with the same level, the comparison will be realized for all the graphs of that level (see above for more information), whereas if the user has selected two assessments with different levels, only the graphs of the lower level will be available for the comparison.
2. Main results
In this section we illustrate the main results and outcomes that are obtained employing the Ocular Mathematical Virtual Simulator on the database described here, whereas the discussion about the clinical impact and relevance is addressed in the following section.
-
Tony is an healhy subject that we have considered as the baseline. The profiles of the CRA and CRV blood flow agrees with the profiles measured with medical instruments such as the Eco-Doppler. Moreover the values obtained by the numerical simulations are in the physiological ranges[Williamson1996]. The blood pressure and flow within the lamina cribrosa are in agreement with other work in literature[Guidoboni2014]. All the other patients will be compared to his simulation results.
-
John is a virtual patient that suffers from high intraocular pressure, therefore he is a glaucoma risk subject. The simulation result suggests a higher pressure and blood perfusion within the lamina cribrosa (up to 20%) and a lower blood flow both in the CRA (up to 66%) and in the CRV (up to 71%).
-
Tina is a virtual patient with both high intraocular pressure and retrolamina tissue pressure that it is directly dependent from the intracranial pressure. This subject presents a slightly increase in the pressure and blood perfusion of the lamina cribrosa (up 9%) whereas she shows similar results than the previous patient (John, only high IOP) in the CRA and CRV (lower blood flow 64% and 72%, respectively).
-
Margaret is a virtual patient that suffers from high IOP, RLTp and blood pressure. The simulation results suggest higher blood pressure (up to 28.1%) and higher blood perfusion (28.2%) within the lamina cribrosa. The behavior of CRA and CRV is quite different CRA blood flow presents higher values up to 27%, whereas CRV blood flow profile is quite different from the baseline; indeed the twofold influence of high IOP and hypertension act on different segment of the CRV and the values attained are higher than baseline up to 58% at systolic peak or lower than baseline up to 43% at diastolic peak.
-
Sophie is a virtual patient with a Idiopathic Intracranial Hypertension (IIH) risk. The simulation results do not significally differ from the baseline values (Tony), in fact the lamina cribrosa hemodynamics is higher by 0.2%, the CRA flow is lower by 0.3% and the CRV flow differs from the CRV baseline value by less than 0.1%.
-
Luke is a virtual patient that suffers from intracranial hypotension. Also for this subject the simulation results are not particularly different from the baseline values. Lamina cribrosa blood pressure and blood perfusion differ from the healthy subject (Tony) by 0.2% and 0.4%, respectively. CRA and CRV blood flows are slighly higher (0.3%) than baseline results.
-
Max is a virtual patient that has low introcular pressure. The simulation results suggest a difference up to 2.2% for the blood pressure and up to 2.4% for the blood perfusion within the lamina cribrosa. CRA and CRV blood flows are higher than the baseline up to 4.5% and 13.9%, respectively.
-
Clara is a virtual patient with ocular hypotony risk that suffers from low IOP and low RLTp. Lamina cribrosa hemodynamics is lower than baseline values up to 2%. CRA and CRV show a higher blood flow up to 4.7% and 14.2%, respectively.
-
Jim is a virtual patient that suffers from ocular hypotony but also is an hypertensive patient. The simulation results suggest an increase in lamina cribrosa perfusion by 29.6% and an increase of CRA/CRV blood flow up to 39.2% 35.4%, respectively.
-
Jenny is a virtual patient with tachycardia. The blood pressure and flow profiles within lamina cribrosa, CRA and CRV reach similar peaks with respect to the baseline values, however the frequency of peaks and the shape of profiles is slightly different as expected.
3. Discussion
In this section we consider the results presented in the previous section and we point out some possible interests from an ophthalmological viewpoint.
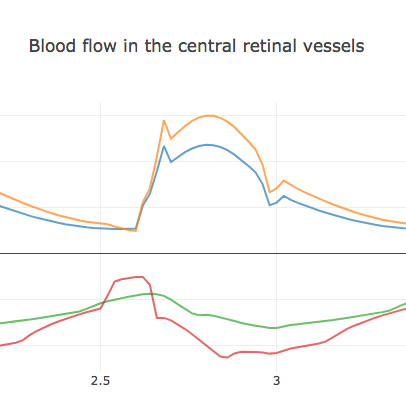
In subjects with high IOP (John, Tina, Margaret), it is easy to point out a drop down of the blood flow especially in the CRV very likely due to the collapse of the veins, which is exactly what ophthalmologists observe from a physiological viewpoint. It is of particular interest the CRV blood flow profile in Margaret, indeed the the blood pressure at diastolic is not enough to balance the high value of IOP of this subject. At a certain moment of each cardiac cycle the value of blood pressure is lower than the crucial value of external IOP and the blood flow drops down as depicted in Fig. 1; the vein collapse since the value of the internal pressure is lower than the external one. In Fig. 1 the orange and the blue lines correspond to CRA blood flow profile of Margaret and Tony (baseline), respectively. The red and the green lines represent the CRV blood flow profile of Margaret and Tony, respectively.
From the results obtained and presented in the previous section, we highlight also the overall effect that a change of a particular parameter has on the overall system.
As expected an increment of the systolic/diastolic blood pressure raises a proportional increase in the perfusion within the lamina cribrosa, CRA and CRV. For what concerns the IOP and the RLTp, the simulation results suggest a direct proportionality in the lamina cribrosa whereas an inverse one is predicted in the central retinal vessels. This fact may be correlated to the need of blood to find new way of flowing in case of high IOP or RLTp, indeed an increment of these pressures lead to a greater external force on the vessels, which makes venules and veins collapse. However an increment of blood flow in the lamina cribrosa won’t necessarily mean a better perfusion, rather an excessive blood flow rise may lead to a blow up in the optic disc microvasculature.
4. Conclusion
We have showed how the Ocular Mathematical Virtual Simulator is able to simulate very different situations that are all significant from a clinical viewpoint. These results are easily accessible via the online visualization tool with the two different apps that are provided.
In this chapter we have presented an example of clinical research on simple virtual database, however a similar approach can be employed on a large dataset with real measurements.
Bibliography
-
Williamson TH, Harris A. Color Doppler ultrasound imaging of theeye and orbit. Survey of ophthalmology. 1996; 40.4: 255-267.
-
Guidoboni G, Harris A, Cassani S, Arciero J, Siesky BA, Amireskandari A, Tobe L, Egan P, Januleviciene I, Park J. Intraocular pressure, blood pressure, and retinal blood flow autoregulation: a mathematical model to clarify their relationship and clinical relevance. Investigative ophthalmology & visual science. 2014; 55(7), 4105-4118.