IOP scenario - Level 2 application
This is an example of clinical scenario that involves two patients with different intraocular pressure (IOP). The simulation results have been obtained employing Level 2 of the Ocular Mathematical Virtual Simulator.
Data
The data of the two virtual patients are similar with the exception of the IOP as shown in Fig. 1.
In particular, patient 1 (P1) has an IOP=16 mmHg, whereas the pressure inside the eye of patient 2 (P2) attains 25 mmHg.
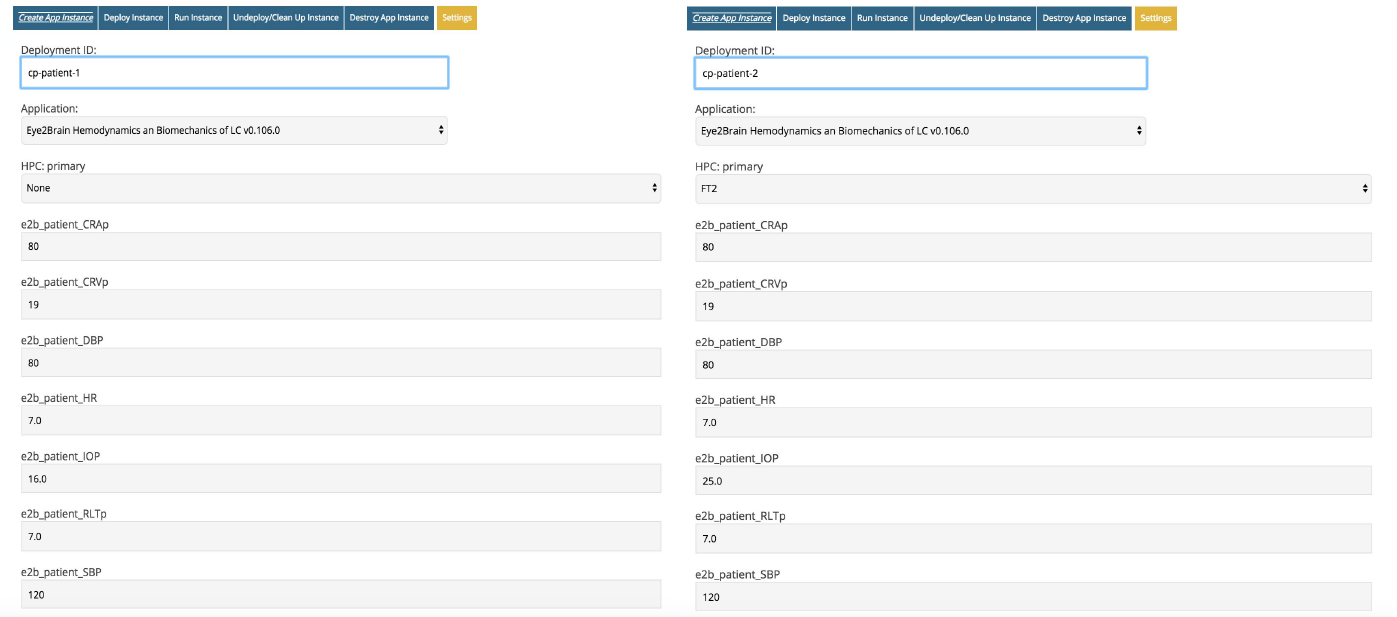
The time interval for the simulation is 0 - 4 s.
Simulation results
The Ocular Mathematical Virtual Simulator was used for this clinical scenario to predict:
-
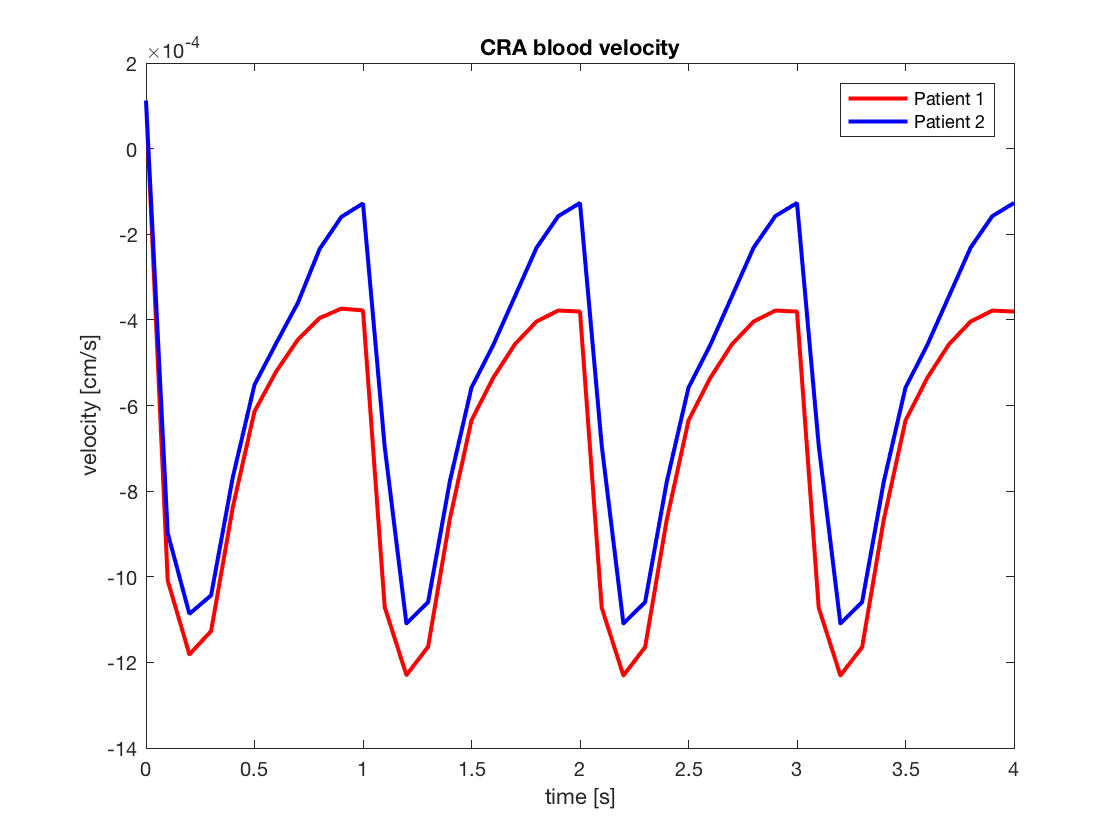
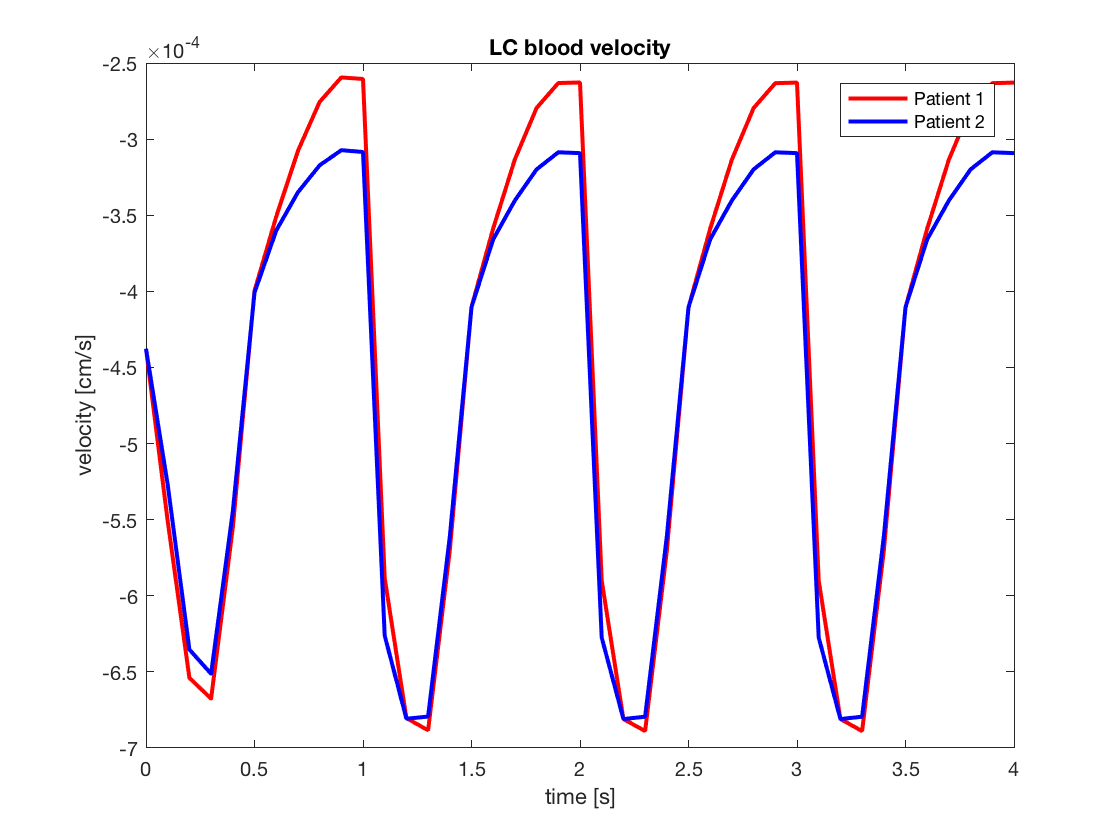
CRA/CRV blood flow (Figs. 2 and 3);
-
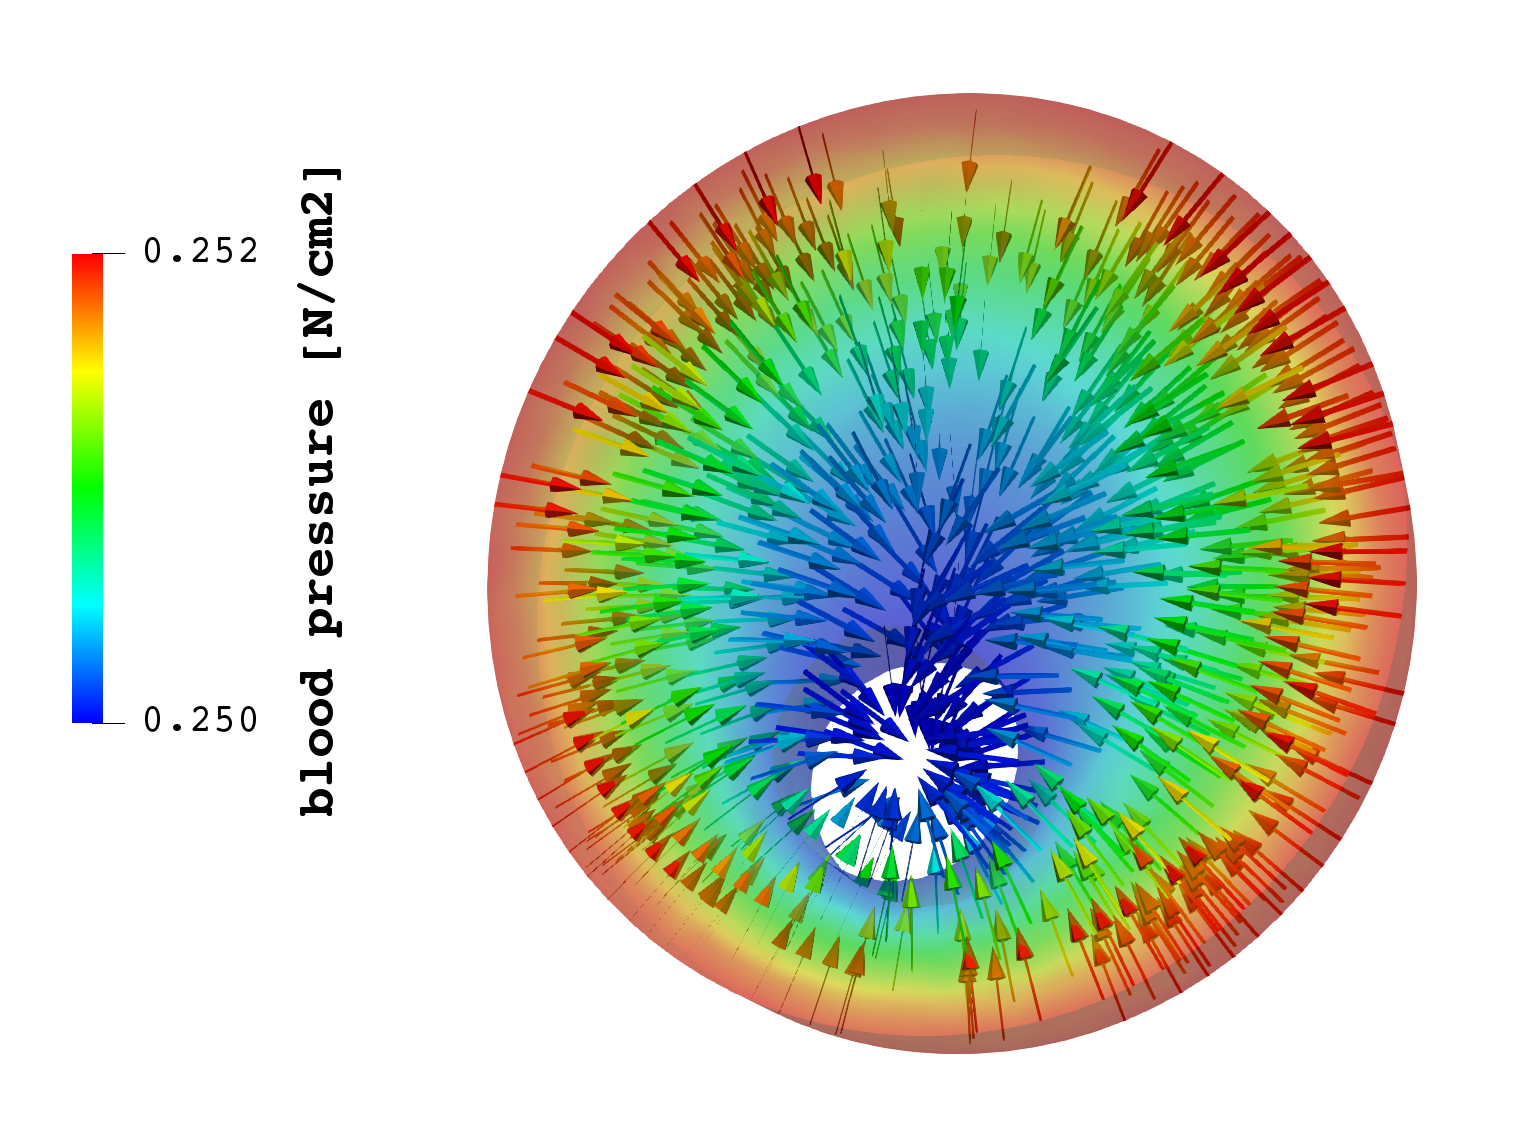
lamina cribrosa hemodynamics (Fig. 4 and 5);
-
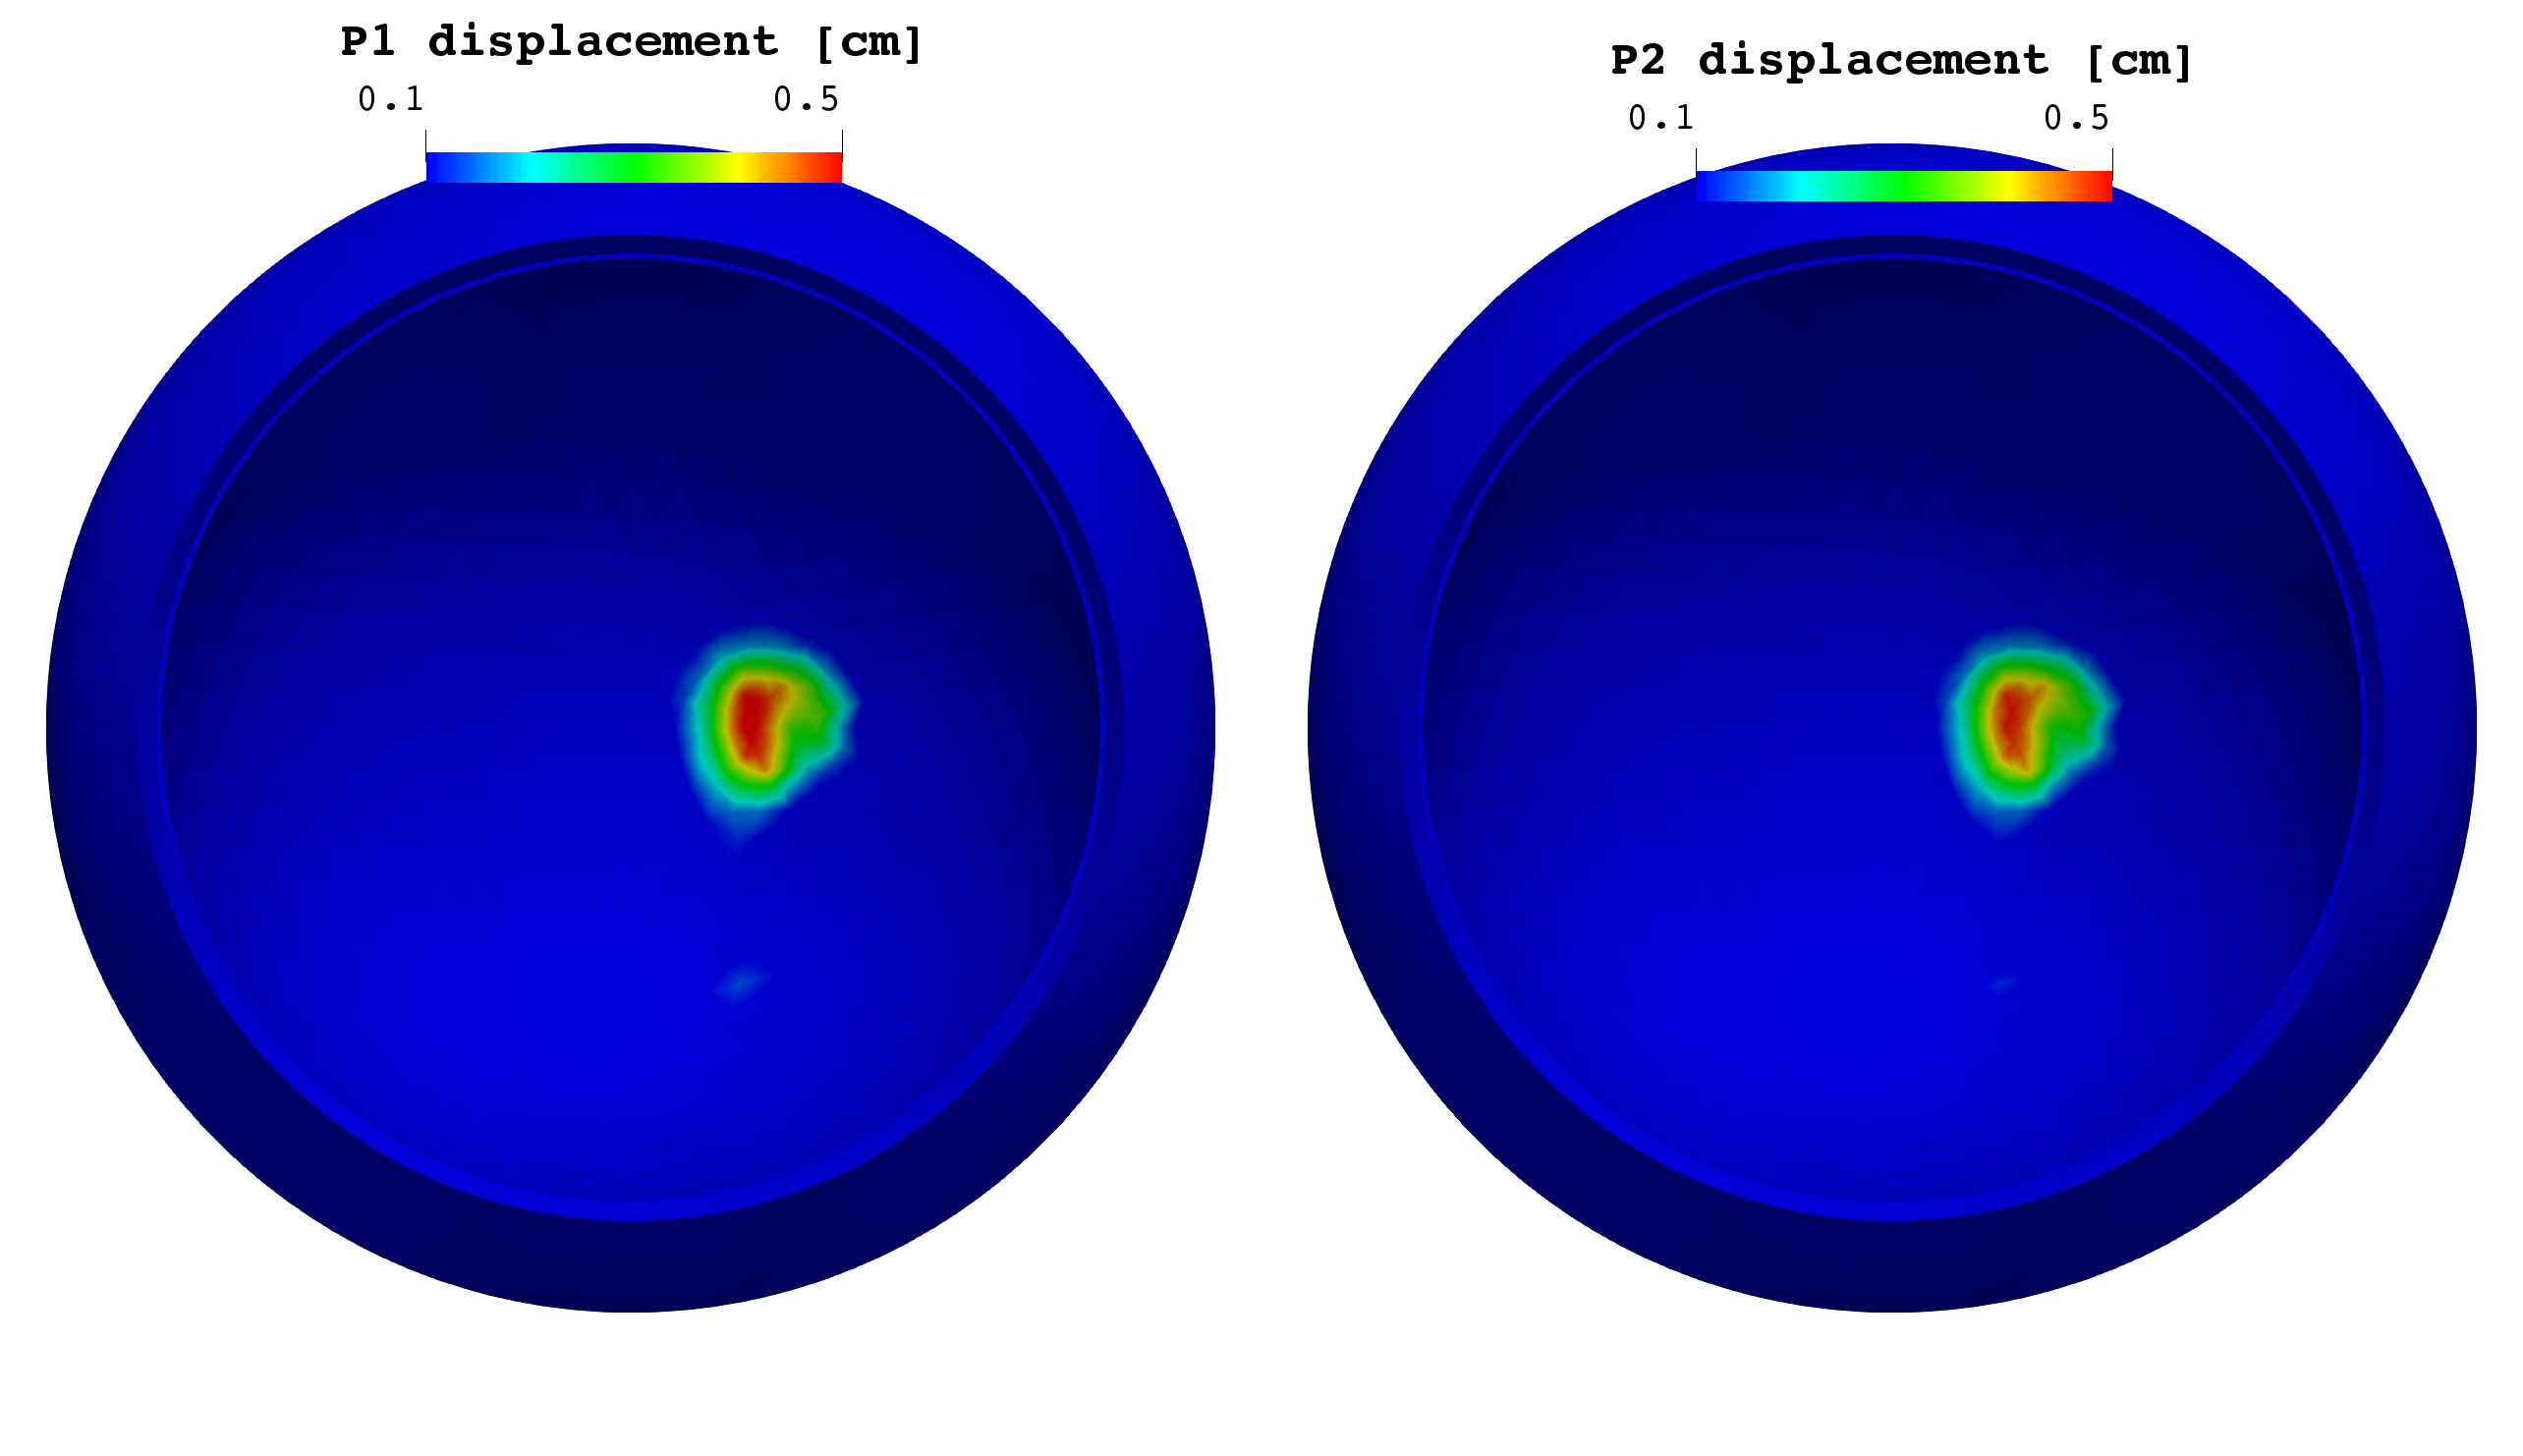
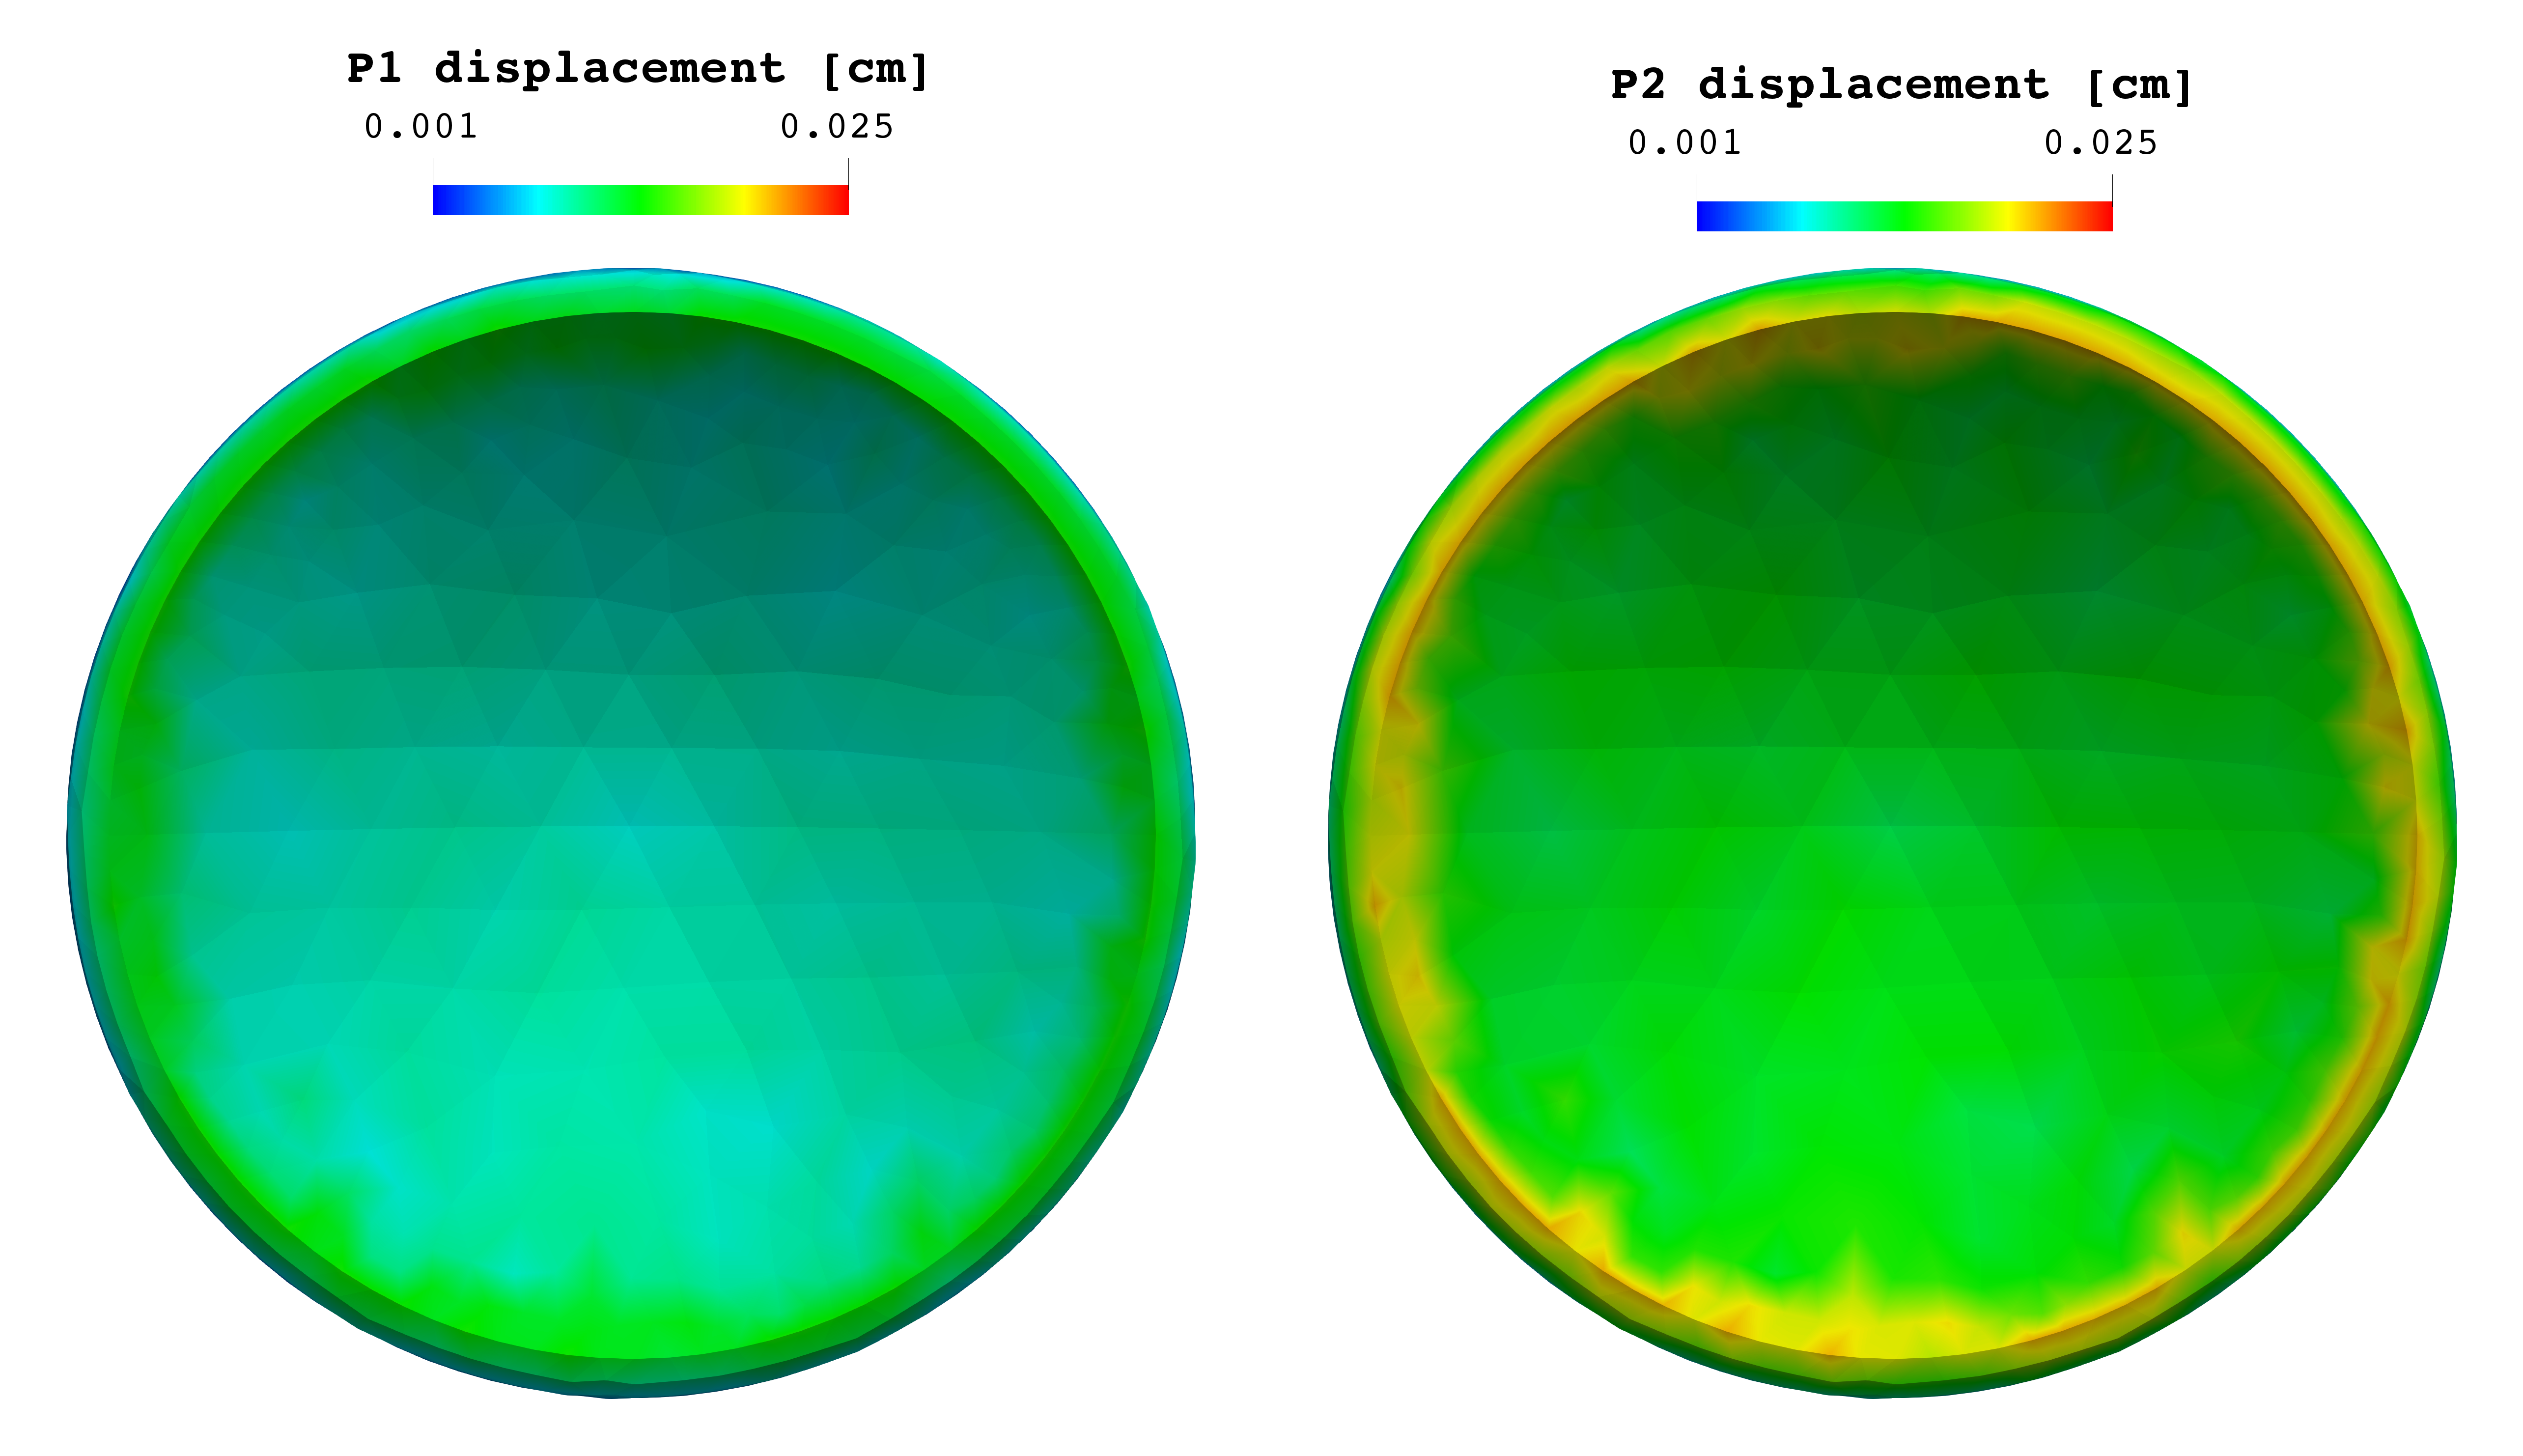
lamina cribrosa displacement spatial distribution (Figs. 6 and 7);
-
retina and choroid displacement spatial distribution (Fig. 8);
-
cornea displacement spatial distribution (Fig. 9).
|
|
Figure 2: time evolution of CRA blood velocity profile |
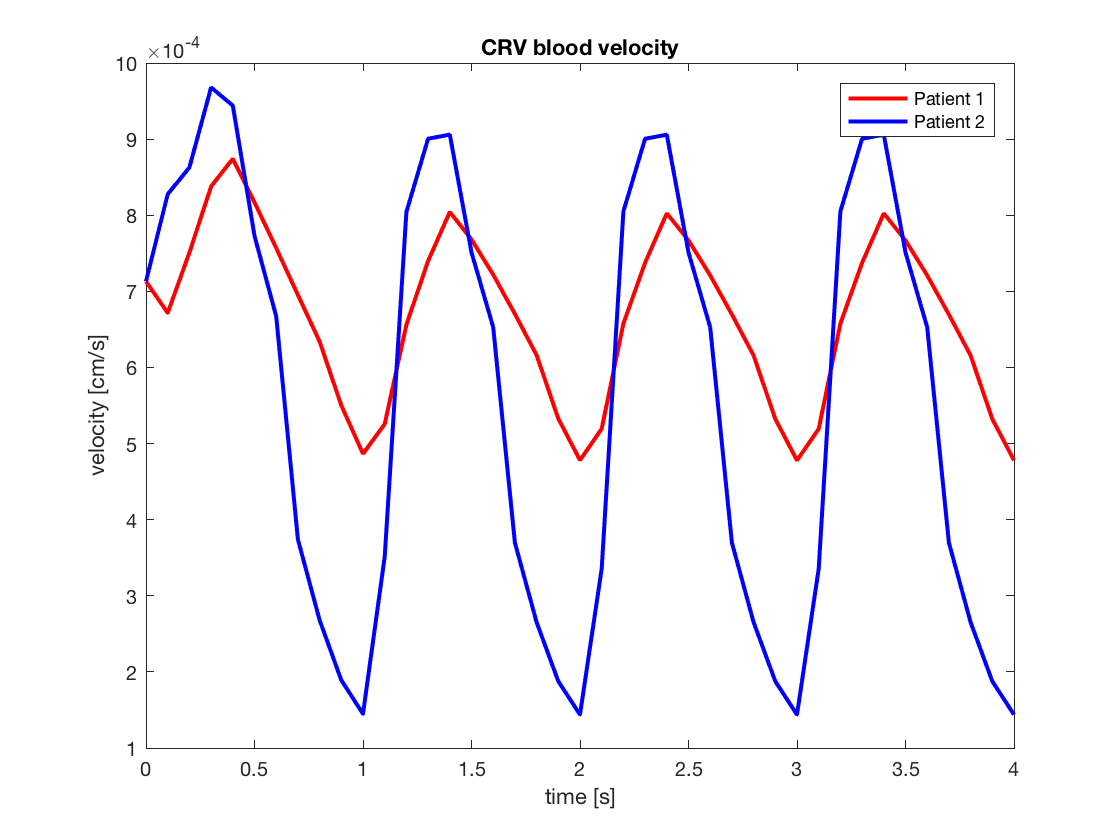
Figure 3: time evolution of CRV blood velocity profile |
|
|
Figure 4: lamina cribrosa blood pressure distribution at time |
Figure 5: lamina cribrosa 1d cut blood perfusion at time |
|
|
Figure 6: lamina cribrosa time evolution of displacement field |
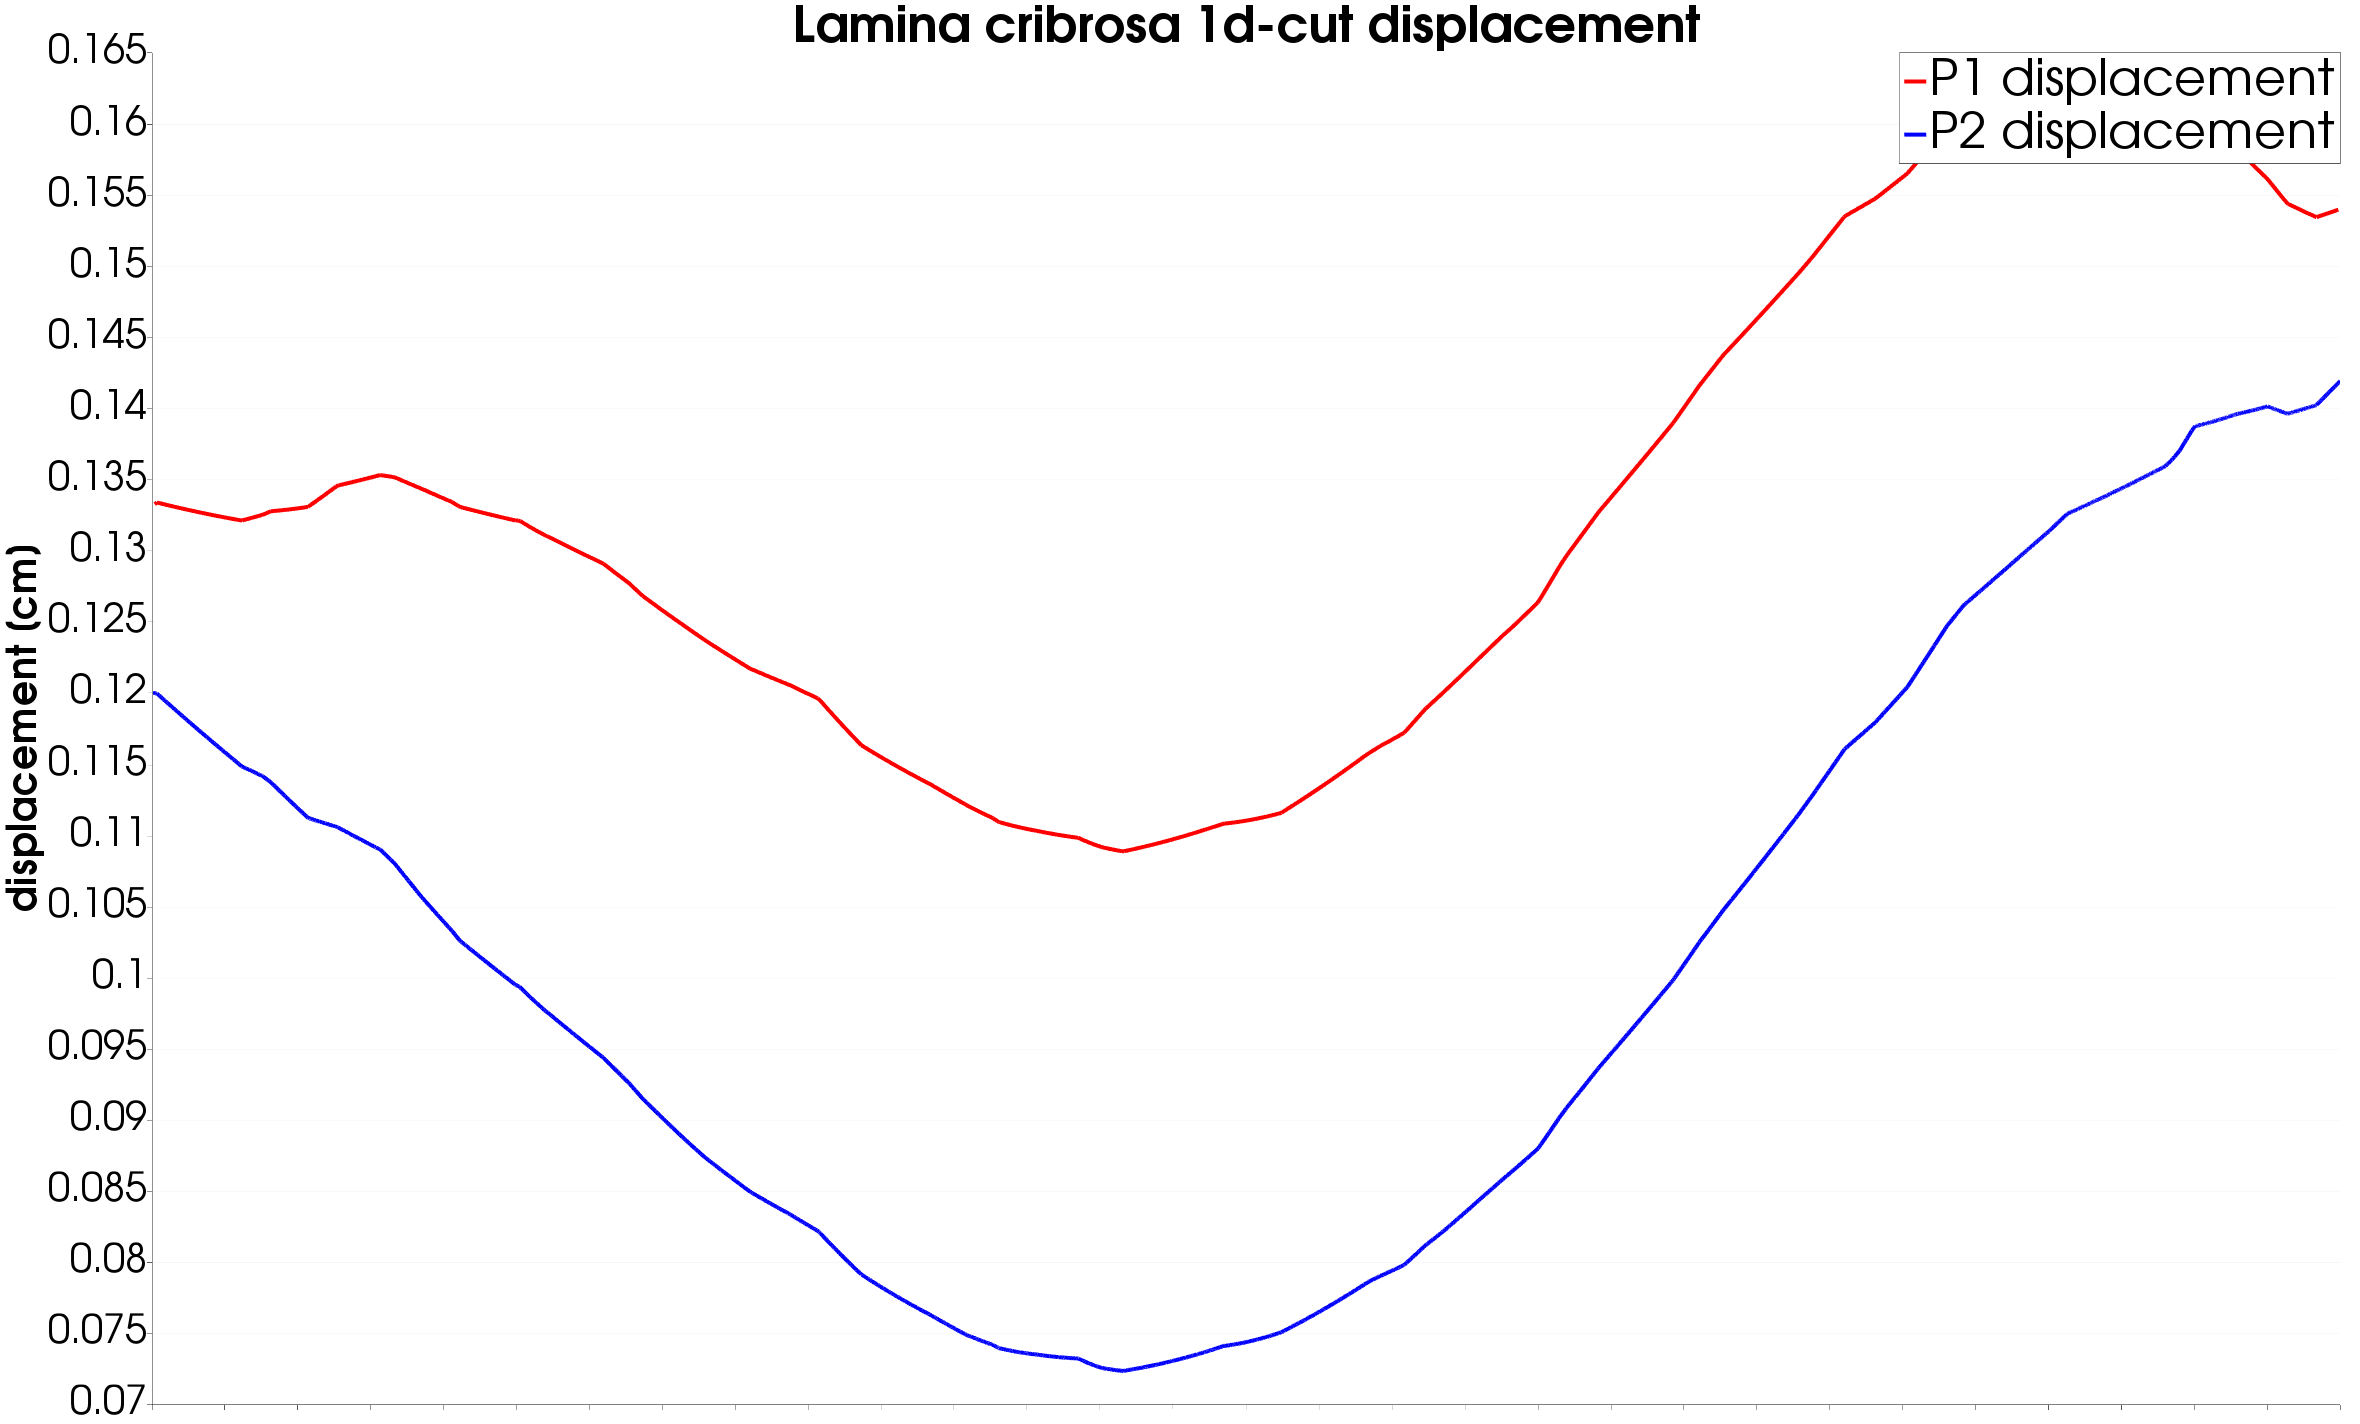
Figure 7: lamina cribrosa 1d cut of displacement at time |
|
|
Figure 8: retina and choroid displacement field at time |
Figure 9: cornea displacement field at time |
Discussion
The blood velocities within the central retinal vessels are highly influenced by the IOP, especially the CRV (Fig. 3) collapses if the IOP is higher than the blood pressure within the vein.
There is a difference up to 2% in the blood pressure ditributionand up to 5.5% in the tissue perfusion between the two patients (Fig. 5).
There is a difference up to 33% in the lamina cribrosa displacement distribution (Figs. 6 and 7) between the two patients with an applied strain that is doubled in patient 2. The results also show that after the first two cardiac cycles where the tissue suffers from high stress, the system converges to a steady equilibrium.
There are no relevant differences between P1 and P2 for the displacement in the choroid and retina, whereas the cornea shows higher displacement along the border for patient 2 due to higher IOP.
In conclusion the simulation results obtained via the Ocular Mathematical Virtual Simulator suggest that: - high IOP causes CRV to collapse with a consequent influence on the overall system; - differences in IOP may lead also to significant differences in the lamina cribrosa blood perfusion (5.5%); - differences in IOP lead, as expected, to significant differences in the displacement (up to 33% in the lamina).