Translaminar tissue pressure scenario - Level 0 application
Data
This is an example of clinical scenario that involves three patients, an healthy subject that we denote as the baseline, and two pathological individuals that we define as patient1 and patient2.
The three individuals have the same blood pressure (120/80 mmHg).
Baseline and patient1 shares als the same translaminar tissue pressure difference (TLPd = 8 mmHg), however the healthy individual has an IOP = 15 mmHg and a RLTp = 7 mmhg, whereas patient1 shows a
pathological high IOP = 25 mmHg and high RLTp = 15 mmHg.
Patient2 presents a pathological high IOP = 25 mmHg and a regular RLTp = 7 mmHg.
The simulations are perfomed using Level 0 of the Ocular Mathematical Virtual Simulator.
Simulation results
Discussion
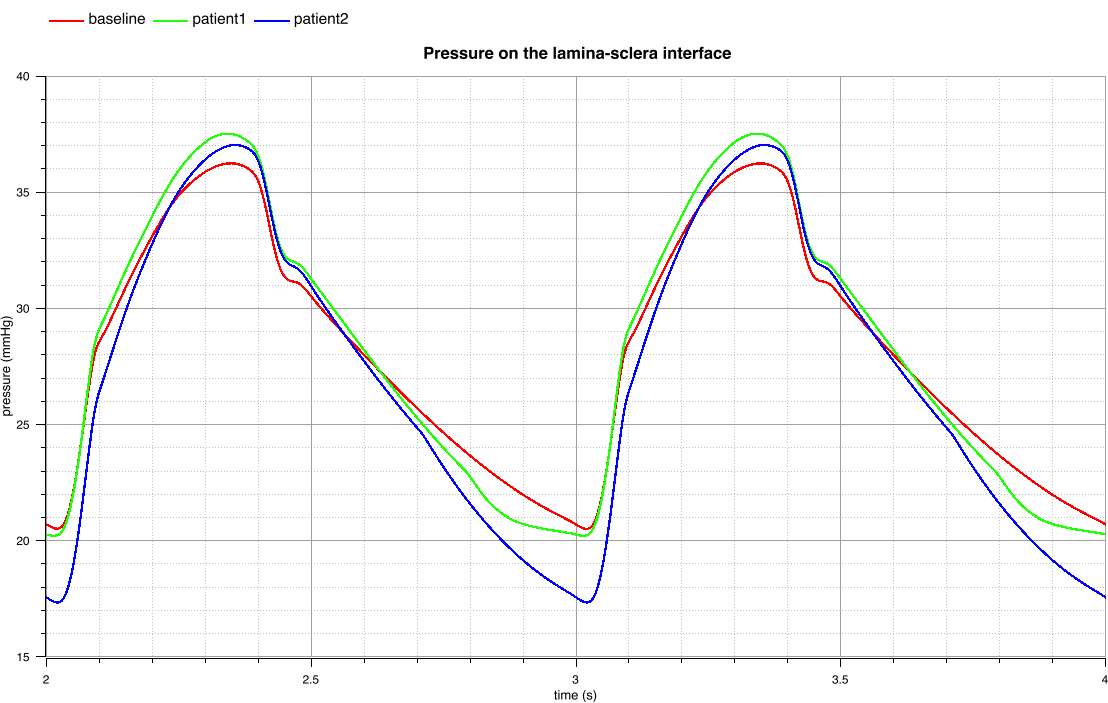
For what concerns the blood pressure within the lamina cribrosa, the baseline value at the peak has a difference up to 3.5% and 2.1% to patient1 and patient2, respectively.
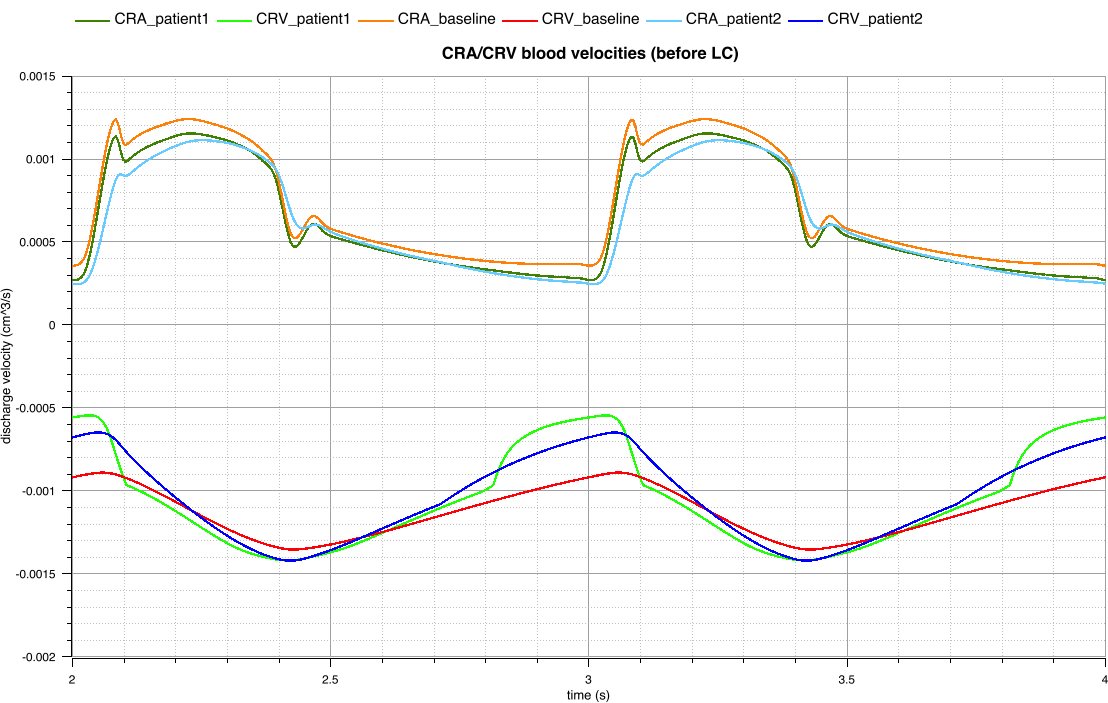
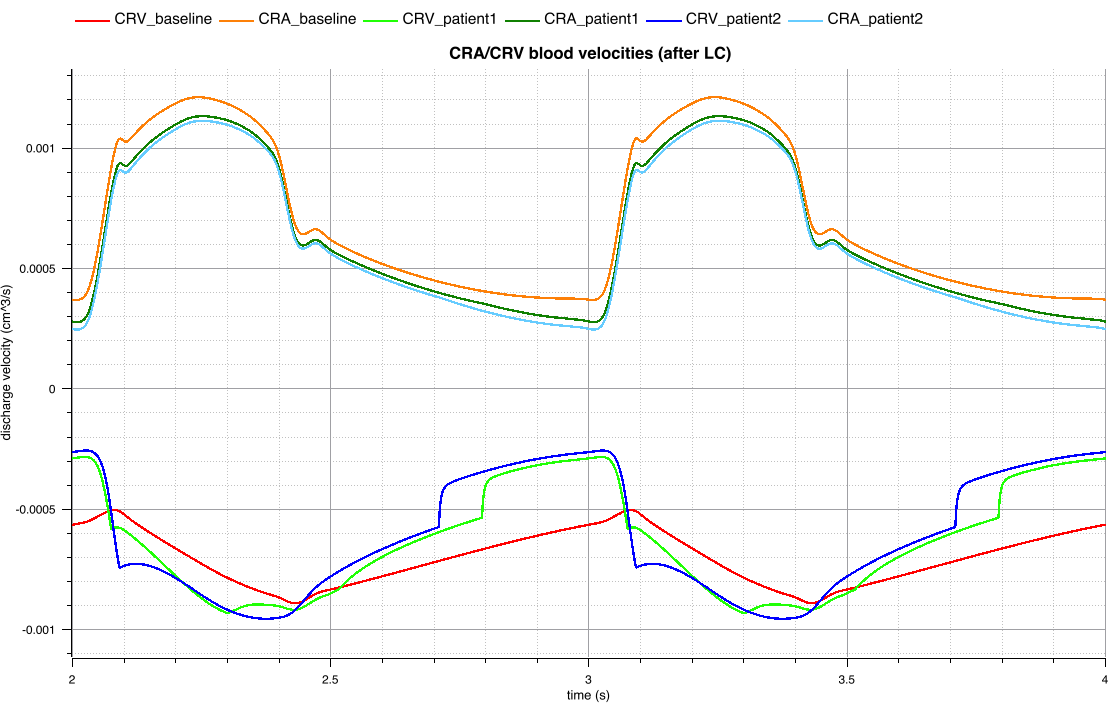
In the analysis of the CRA/CRV blood velocities we have the following discrepancies between the baseline values and the pathological values at the peak:
-
before the lamina cribrosa junction the results show a difference in the CRA up to 7% for patient1 and 10% for patient2. In the CRV the differences are remarkable and they are up to 39% for patient1 and 26% for patient2
-
after the lamina cribrosa junction the results present discrepancies in the CRA up to 6.6% and 8.2% for patient1 and patient2, respectively. In the CRV we point out a difference between baseline and patient1 up to 48%, whereas between baseline and patient2 up to 53%.